Every software developer needs to check what’s under the hood from time to time. For beginners first choice will be naturally print_r paired with <pre> or “more advanced” var_dump. Even if there is nothing really bad with this solution there it can be done better.
Of course such approach may need additional effort to make it work but in most cases it’s worth trying to debug like a pro.
In this article we’re recommending Xdebug. This PHP extension will allow you to see what’s happening inside your app, check global arrays like $_POST or $_GET, look inside objects and watch which variables are currently set. Moreover – Xdebug allows to execute your app line by line and see what is happening during request.
As a bonus – Xdebug is good for testing ajax requests. Normally your endpoint is returning JSON or XML. When you use var_dump inside such output you will ruin document formatting and get an error in your JavaScript, which should receive and parse a response. Using debugger you just delay execution but after debug process output will stay untouched.
To start with Xdebug you first need to install and configure php extension.
For installation on linux (debian-based) systems you can use:
sudo apt-get install -y php5-xdebug
Then you need locate configuration file which can be found in:
– apache: "/etc/php5/apache2/conf.d/20-xdebug.ini"
– php-fpm: "/etc/php5/fpm/conf.d/20-xdebug.ini"
Base configuration of Xdebug which should work on any environment is:
xdebug.remote_enable=1
xdebug.remote_autostart=1
xdebug.remote_connect_back=1
xdebug.remote_port=9000
xdebug.idekey = "idesecretkey"
xdebug.remote_handler=dbgp
xdebug.remote_mode=req
Depending on the IDE you are using you need to configure it as well.
If you see Fatal error: Maximum function nesting level of ’100′ reached you should set xdebug.max_nesting_level = XXX where XXX is nesting depth = 200 (or more) in your configuration.
Configuring PhpStorm to use Xdebug on dev environment
For PhpStorm which claims “zero configuration”, so it’s as easy as setting IDE Key and port (if needed – by sticking with the key “PHPSTORM” and port 9000 then it’s already done for you) and starting listening for incoming connections.
Procedure is well described on PhpStorm zero configuration Xdebug manual so there is no need to copy it here.
Additionally if you want to provide your own IDE key or change listen port just provide them like described here. There is nothing more to do. If Xdebug extension is configured properly and IDE key and port match those in Xdebug config, plus when you’re debugging external host-path mappings are correct everything should just work.
Configuring Netbeans to use Xdebug on dev environment
1. Setup general NetBeans properties in Tools → Options → PHP → Debugging

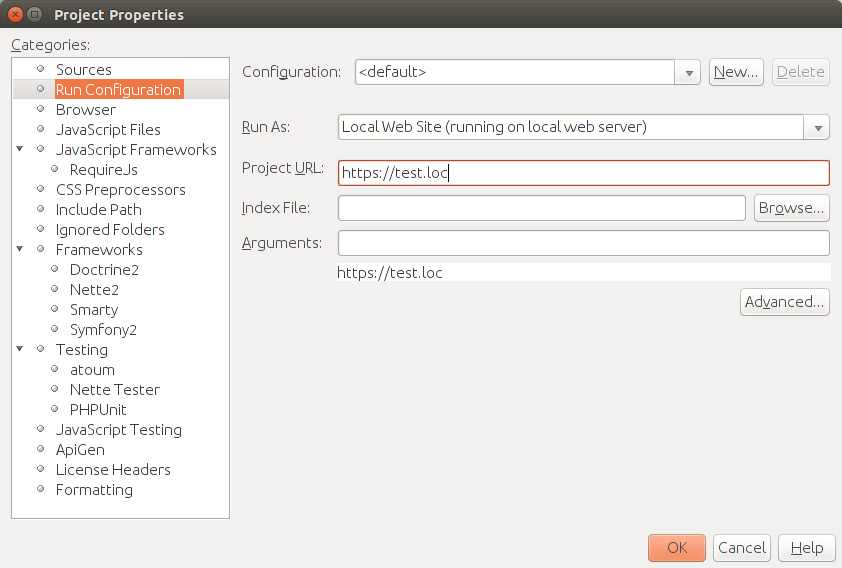
2. Setup project properties in File → Project properties
– select in left menu “Run Configuration” and check or specify your project URL

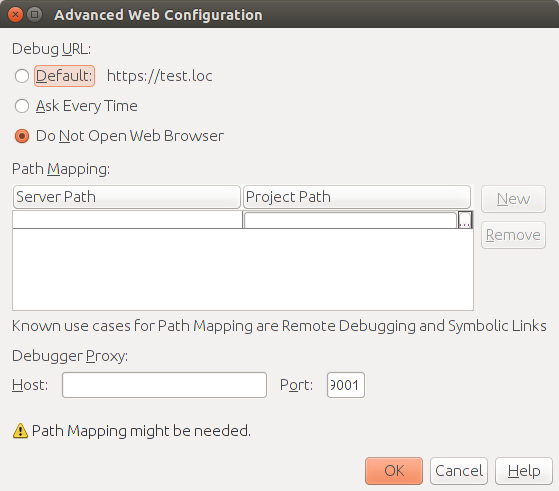
– click on “Advanced” button under “Arguments” field and select “Do not open browser”. In this case NetBeans will not open new windows after debug session will be started.

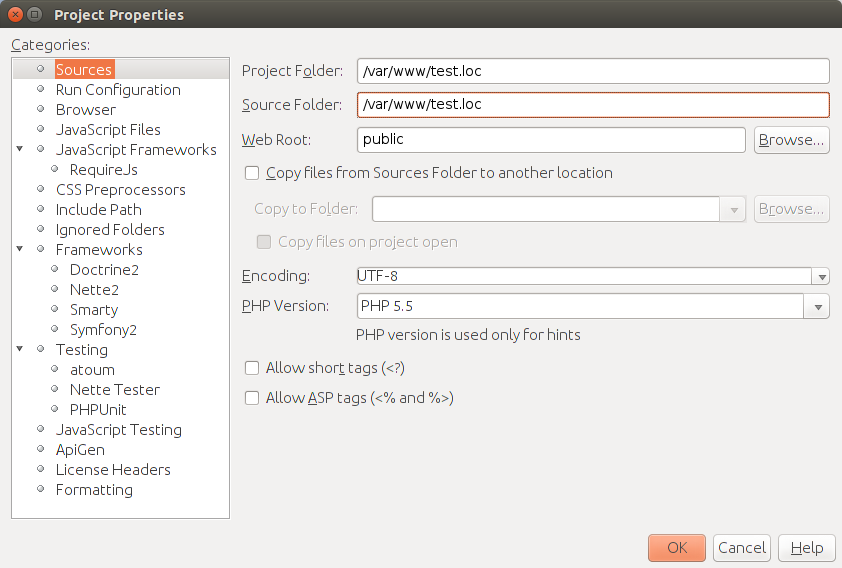
3. Select in project configuration in right menu item “Sources” and specify small and but very important configuration option “Web Root”. Click on “Browse” button and select the folder where your init php script is placed.

Start Xdebug session inside your web browser
Install Xdebug plug-in for you dev browser and configure idekey for remote debugging.
After this you should enable debug plug-in in browser, set breakpoint and start debugging session in IDE, refresh browser page. IDE (if listening for incoming debug connections) should handle debug session and will focus cursor on first breakpoint.
Mozilla: addons.mozilla.org/EN-US/firefox/addon/the-easiest-xdebug/
Chrome: chrome.google.com/webstore/detail/xdebug-helper/eadndfjplgieldjbigjakmdgkmoaaaoc
authors: Sergii Shostak; Bartek Telesiński


