Categories
Software Technology

Java integration tests with Spring

Recently, we had to write integration tests because a connection with the database was required in almost all aspects of our business logic. Writing only unit tests without a DB connection didn’t make much sense – we were only able to check if the API returns a proper error message in cases like no records or unsuccessful authentication. Therefore, it was necessary to test using the database.

It’s important to test the DB connection without changing the structure of the production database – but how can this be done? The answer is quite simple – use two databases – the production one and the test one.

Our project is written in Java using the Spring 4 platform.
First, I created a test database using dump from the original one.
I prepared scripts to create, recreate and drop this database as needed, which were added to Makefile.

Now, how can you force the application to use the regular database in all cases except test, where it should use the test database? You just have to swap the database.properties file.
My original database.properties looked like this:

datasource.driver-class-name=org.postgresql.Driver datasource.url=jdbc:postgresql://127.0.0.1:5432/my_database datasource.username=my_username datasource.password=my_pass

I added a database-test.properties file:

datasource.driver-class-name=org.postgresql.Driver datasource.url=jdbc:postgresql://127.0.0.1:5432/test_db datasource.username=test_username datasource.password=test_pass

We can use a different property (not only for the database, but for everything else as well) using a Spring annotation from spring-test dependency.

The test class should have 3 annotations:
@RunWith (SpringJUnit4ClassRunner.class) – Indicates that the class should use Spring’s JUnit facilities
@ContextConfiguration (Application.class) – Indicates ApplicationContext.
My Application.class looks like this:

 @Configuration
 @PropertySources({
    @PropertySource("classpath:database.properties"),
    @PropertySource("classpath:application.properties")
 })
 @ComponentScan
 @EnableAutoConfiguration
 public class Application extends SpringBootServletInitializer {
    @Override
    protected SpringApplicationBuilder configure(SpringApplicationBuilder application) {
       return application.sources(Application.class);
    }
}

And to override original properties you should just use @TestPropertySource annotation. It is a class-level annotation, configuring the location of property files and inlined properties which should be added to set of PropertySources in the Environment. The test property sources have a higher priority than those added declaratively or programmatically using @PropertySource annotation. It works fine to override single classes and make them use different property sources than in the rest of application.
So, the entire test looked more less like this:

 @RunWith(SpringJUnit4ClassRunner.class)
 @TestPropertySource("classpath:database-test.properties")
 @ContextConfiguration(classes = Application.class)
 public class SomethingIntegrationTest {
    @Autowired
    private SomeRepo repo;
    @Test
    public void should_return_proper_something_list_size() {
       List allSomethings = repo.getAllSomethings();
       assertThat("Somethings list should return 7 records", allSomethings.size(), is(7));
    }
 }

I added this dependency to pom.xml file:

<dependency>  <groupId>org.springframework</groupId>  <artifactId>spring-test</artifactId>  </dependency>

We’re skilled in Java programming, but we’re also experts in creating software in many different languages… if you’re interested, take a look at our services.
author: Iga Stępniak

Categories
Software Technology

5 Things to Know About Ad Tech for Smartwatches

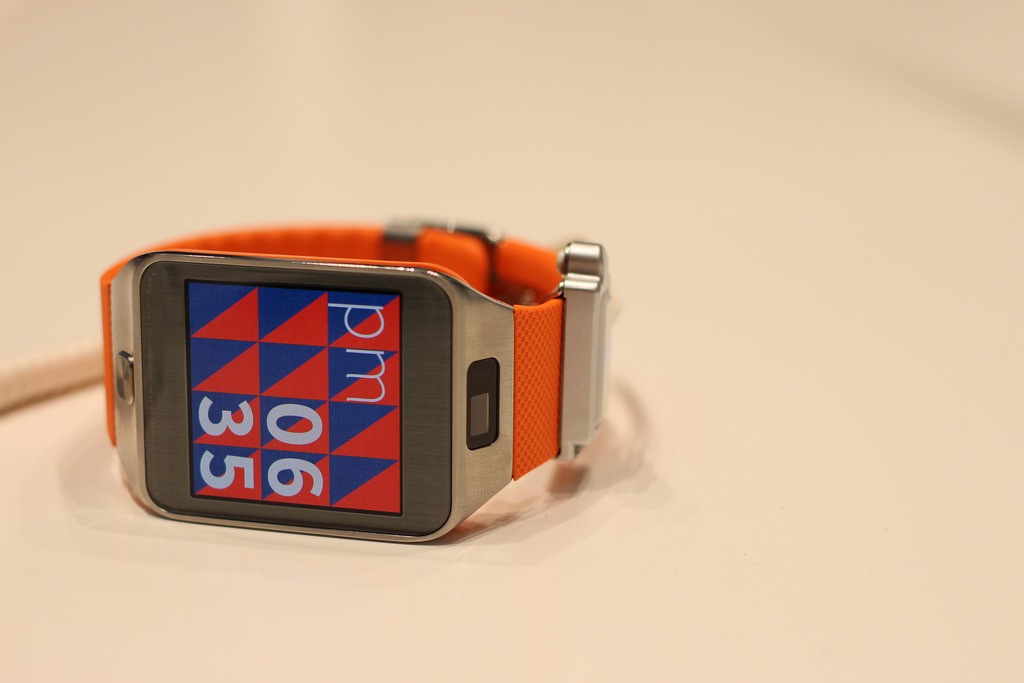
Ad tech for wearables is dubbed the ‘third wave of digital advertising’, and rightly so: advertisers are set to spend $68.6 million by 2019 on smartwatch ads by 2019, up from an estimated $1.5 million this year. It’s a good bet – people are buying wearables, and the smartwatch – like the Apple Watch – might become the most frequently chosen smart device. Yet, there are many barriers of entry for advertisers: you just can’t push TV or web ads anymore. Thankfully, we know how to deal with the new medium.

1. Keep it short and sweet

A potential customer will likely only glance at a smartwatch for a couple of seconds. Wearables are designed for rapid interaction, so you’ll need to familiarize yourself with “glanceable marketing” – succinct, attractive ads designed to grab a potential customer’s attention practically immediately. There is no way ‘old’ mobile advertising is going to work with a stamp-sized (OK, it’s a big stamp) format, there’s only so many words you can fit onto a smartwatch screen, so make sure they’re the right words.

2. Keep it personal

An advertising message should aim to deliver a service – or product – when it’s needed. Geo-targeting is your keyword – you know where your customer is, so you base your ad on location. Plus, the smartwatch is an intimate device: so make use of all that Quantified Self data wearable technology is collecting – a bad night’s sleep: how about a coffee? Here’s a coupon. We see your running activity is up suddenly: here’s a native article warning against running injuries. What’s more, many smartwatches are still linked to other devices. Think creatively – gaining a deep insight into cross-device usage can be an added bonus.

3. Keep testing – and don’t be afraid to ask

Carry out plenty of A/B tests and see what works better. It’s up to the users to determine whether the ads work or not, and conversion is king. Make a few versions, brainstorm ideas, and don’t be discouraged. It’s a new channel. It isn’t enough to transfer existing campaigns to the smartwatch. It’s likely you’ll need some help from the outside. Many specialized software companies are very aware of this new trend in advertising and offer personalized ad tech solutions.

4. Keep the options in mind

  • Coupons – money-saving is generally a good idea, but make sure customers can opt out
  • Native ads – as long as you’re selective, and tailor them to the right customers
  • Search marketing – searches are always a mine of information
  • Short videos – the circumstances are limited, but it’s possible: like showing a movie trailer when a person focuses on a poster for a long time
  • Push notifications – this is why mobile apps are the key to the smartwatch market, but this is difficult ground – if notifications are obnoxious, the app will be uninstalled

5. Keep privacy in mind

Of course, marketers are rubbing their hands together in joy – tapping into all that personal information can provide so many opportunities to match ads to particular consumers. On the other hand, there are privacy concerns that need – and eventually will – be addressed, and certain behaviors might be curbed. The key issue is, well, not to be annoying. Your potential customer can turn into a brand hater if you bombard him or her with unwanted ads. Think more convenience, less marketing.

In a nutshell – advertisers will greatly benefit from smartwatch marketing, but they need to understand the context. Built-in health and GPS technology can be a blessing in helping advertisers figure out what users might want – right now, the app ecosystem will reign, and knowledge of ad tech plus great app development are the key to smartwatch success. Getting through the tricky parts will be worth it in the end, because not many things get you closer to the customers than the smartwatch.

author: Natalia Brzozowska

Categories
Software Technology

Monitoring with Grafana and InfluxDB

Having multiple distributed services can generate a great deal of data, including health statuses, state changes and many more. One of our projects required a service which could monitor such information and display it in a friendly manner to the user. One of the problems was that we had no influence on some of the services and no notion of technologies they used, except for the ubiquitous REST services via HTTP protocol. It would be a problem if dedicated database clients were required to communicate with the storage or we would have to convince everyone to a new messaging format.

InfluxDB

Fortunately there is a time series database which accepts purely REST communication to persist monitoring information – InfluxDB. It’s a database implemented in Go language which uses an SQL-like language designed for working with time series and analytics.

To display this data we decided to choose Grafana. It’s an easy to use, AngularJS based web-site which has the ability to query InfluxDBs REST interface. One of the advantages of this solution is that it does not require detailed technical knowledge. Moreover I must say that Grafana’s chart displaying layout is very neat.

Installation

To install InfluxDB we need to download a package from the official website and install it via Linux package manager. Grafana is a different story. It’s a static website communicating via AJAX with InfluxDB, so it needs an HTTP server such as Apache.

To save you the pain, I’ve prepared a bash script. First it installs Influx, Grafana and Apache. Then it configures Grafana to communicate with your local InfluxDB (via localhost so you might want to substitute it in config.js) and generates exemplary data persisted into InfluxDB using curl. To download the script, please execute the commands below in your terminal. Bear in mind that the script installs 32-bit version of InfluxDB – if you’ve got a 64bit OS, just change the InfluxDB package URL in the script. One more thing: I’ve tested it only under Ubuntu.

[sourcecode language=”bash” wraplines=”false” collapse=”false”]
wget -O mon-install.sh https://gist.githubusercontent.com/gitplaneta/e559307567cbf02bd78c/raw/65ca4ce29072a2791318196ebb3e0c584c77deb4/gistfile1.sh
chmod +x mon-install.sh
./mon-install.sh
[/sourcecode]

Now you are able to plot a chart in Grafana. Unfortunately I’ve had some problems with floating point precision in Bash so the chart isn’t as pretty as it should but that’s out of scope of this blog post. Let’s plot this ugly … chart!
But before we do that, it’s a good idea to familiarize ourselves with InfluxDB Rest interface.

InfluxDB HTTP interaction

If you open the previous script in the editor, you’ll see that some HTTP requests are being sent to InfluxDB. First, 2 databases are created (one for data and one for Grafana to save its settings) and then one of them is filled with data.

To create a database named “my_new_database”, we send a POST request with JSON body to the InfluxDB instance:

[sourcecode language=”bash” wraplines=”false” collapse=”false”]
curl -X POST ‘http://localhost:8086/db?u=root&amp;p=root’ -d ‘{“name”: “my_new_database”}’
[/sourcecode]

On the other hand, to insert data into the previously created database, we use this POST request with JSON payload:

[sourcecode language=”bash” wraplines=”false” collapse=”false”]
curl -X POST -d ‘[{“name”:”fun”,”columns”:[“val”, “other”],”points”:[[“23.3256”, 100]]}]’ ‘http://localhost:8086/db/my_new_database/series?u=root&amp;p=root’
[/sourcecode]

You might be interested what all these fields mean:

  • name – in SQL domain, we would call it a table,
  • columns – column names,
  • points – an array of values which sequence corresponds to the field “columns”. To make it more efficient you can insert data in bulk, by sending multiple array elements in one request. You can also manipulate the timestamp for each tuple, by adding a column “time” with specific timestamp value, otherwise InfluxDB will associate a timestamp by default.

Ok, so if we managed to create a table and fill it with data, it’s time to query it. Run this request in bash to see what data we previously inserted (this time we use a GET method):

[sourcecode language=”bash” wraplines=”false” collapse=”false”]
curl -G ‘http://localhost:8086/db/my_new_database/series?u=root&amp;p=root&amp;pretty=true’ –data-urlencode “q=select * from my_new_database”
[/sourcecode]

Of course, there are different ways to communicate with InfluxDB, for example you can use the Graphite protocol, send the data via UDP or use any of the language specific clients they provide. There’re many more quirks you can do with it, for more information visit the official docs

Grafana dashboard step by step

First, we will create our dashboard and save it. This way we’ll prove our Grafana configuration is working and it communicates properly with InfluxDB. Navigate to http://localhost/grafana create a dashboard and click save.

Monitoring with Grafana and InfluxDB
Screenshot 1

Now let’s create a new chart by following the second screenshot and clicking on the new chart title and then choosing “edit”.

Monitoring with Grafana and InfluxDB
Screenshot 2

Add a simple query to display a chart. Our data series name is “fun” and column is “val” (this data was generated by our script you’ve run in the installation section).

Monitoring with Grafana and InfluxDB
Screenshot 3

Next, to show more data, add a few queries by hand in row mode by clicking “Add query” and for each query choose “Raw query mode”:

  • select mean(val + 20) from “fun” group by time(1s)
  • select mean(val + 30) from “fun” group by time(10s)

Result should resemble screenshot 4.

Monitoring with Grafana and InfluxDB
Screenshot 4

By manipulating the “Display Styles” section and charts colours, I’ve managed to create this graph:

Monitoring with Grafana and InfluxDB
Screenshot 6

To wrap things up: in this article we’ve managed to configure a simple monitoring environment, we created a sample dashboard with aesthetic graphs and created basic queries for InfluxDB by our own and sent them with curl. Also I’ve showed you a couple of screenshots from Grafana so you could get more familiar with its interface.

Hope you found this post helpful!

author: Radosław Busz

Categories
Software Technology

AngularJS – how to properly use $watch() and $watchCollection

Many AngularJS developers don’t know how to properly use $watch() and $watchCollection(), and they write their own functions to track changes objects. Below is a piece of simple code to demonstrate differences between this two functions and situations when to use them.

$watch() is used to watch changes, for example in some input fields. This function always returns old value and new value.

$watchCollection() is used when trying to push something to a collection, or when removing some elements from it. This function returns previous collection and new collection.

And the third option. If you would like to detect changes inside your collections (deep watch), for example when you have collections and you want to modify some elements in ng-repeat you should again use $watch() function, but as a third parameter put boolean TRUE.

DEMO

script.js


(function() {
  'use strict';
  angular
    .module('app', [])
    .controller('WatchCtrl', WatchCtrl);
  WatchCtrl.$inject = ['$scope'];
  function WatchCtrl($scope) {
    var vm = this;
    vm.name = 'test';
    vm.collection = [{
      id: 0,
      value: 'test'
    }];
    vm.watchCollection = [];
    vm.deepWatchCollection = [];
    vm.watchCollectionCollection = [];
    vm.add = add;
    vm.remove = remove;
    vm.clear = clear;
    vm.refresh = refresh;
    function add(name) {
      vm.collection.unshift({
        id: 1,
        value: name
      });
    }
    function remove() {
      vm.collection.splice(1, 1);
    }
    function clear() {
      vm.collection = [];
      vm.name = '';
    }
    function refresh() {
      vm.collection = [];
      vm.watchCollection = [];
      vm.deepWatchCollection = [];
      vm.watchCollectionCollection = [];
      vm.name = '';
    }
    $scope.$watch('ctrl.name', function(newVal, oldVal) {
      vm.watchCollection.unshift({
        new: newVal,
        old: oldVal
      });
    });
    $scope.$watch('ctrl.collection', function(newVal, oldVal) {
      vm.deepWatchCollection.unshift({
        new: newVal,
        old: oldVal
      });
    }, true);
    $scope.$watchCollection('ctrl.collection', function(newVal, oldVal) {
      vm.watchCollectionCollection.unshift({
        name: newVal
      });
      vm.newValLength = newVal.length;
    });
  }
})();

This is the first part of series of articles on building real-time, highly scalable applications using AngularJS and Node.js frameworks.

author:Sebastian Superczyński