How geolocation and big data can be used to the advantage of your business apps
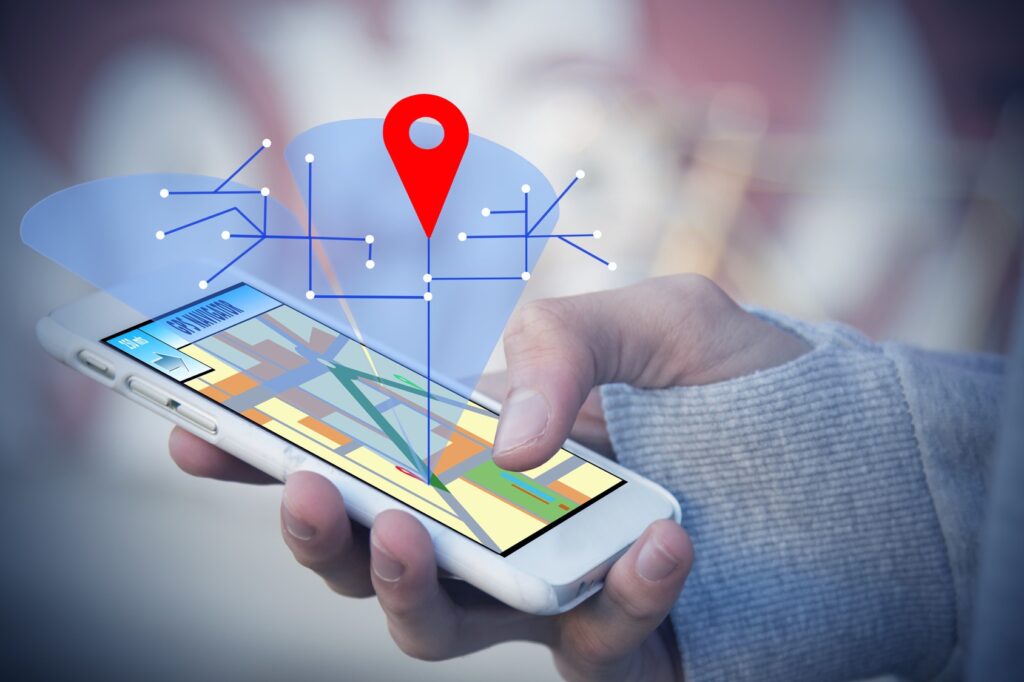
Nearly all industries have improved their efficiency through the use of geolocation. When it is combined with big data it allows for greater client satisfaction including more individualized customer experience, better targeted marketing and enables you to learn more about your own company. Geolocation Apps & Big Data Geolocation is most commonly used in marketing […]
Micropayments: How your Business Can Benefit From Them

To understand ‘Micropayment’ is to understand the technology connected to it. Technology is constantly improving, affecting every aspect of our lives. One of the biggest challenges in life is simplifying our finances and the best way to do this is via Fintech (financial technology)- a developing area that brings together the best financial products worldwide […]
Smart contract use cases: commodity trading (tiqpit)

Tiqpit’s idea to move commodity trading to the blockchain is one of our most recent smart contract use cases. As co-founder Mike Ziemkendorf said, tiqpit was born out of the move to Malta: the confrontation with the situation on the small island, paired with the founders’ insider knowledge of how commodity trading works. See how tiqpit aims to […]
Build your own error monitoring tool
In this tutorial, I’ll describe how you can create your own error watcher. The final version of this project can be found on GitHub. I’ll later refer to the code from this repository, so you can check it out. Why use even a simple error monitoring tool? If your application is on the production or […]