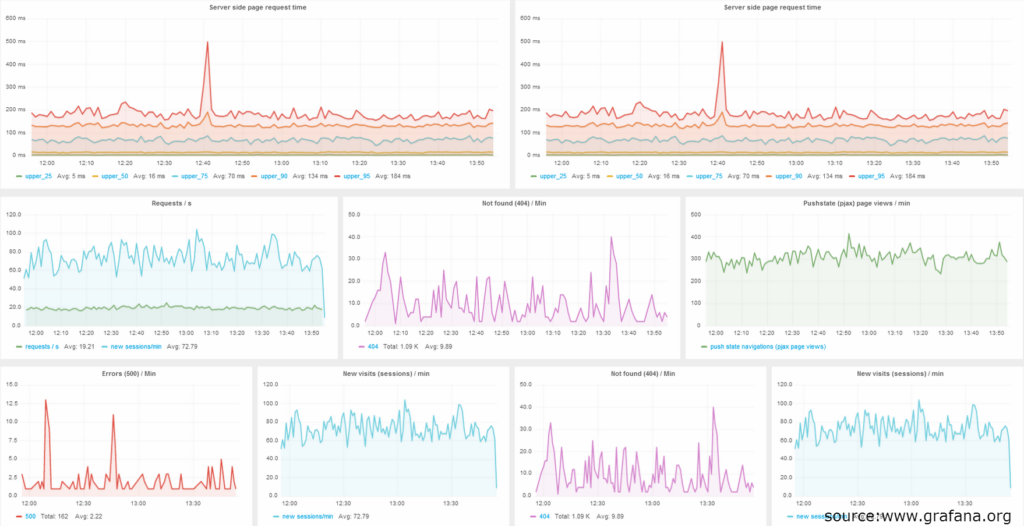
Having multiple distributed services can generate a great deal of data, including health statuses, state changes and many more. One of our projects required a service which could monitor such information and display it in a friendly manner to the user. One of the problems was that we had no influence on some of the services and no notion of technologies they used, except for the ubiquitous REST services via HTTP protocol. It would be a problem if dedicated database clients were required to communicate with the storage or we would have to convince everyone to a new messaging format.
InfluxDB
Fortunately there is a time series database which accepts purely REST communication to persist monitoring information – InfluxDB. It’s a database implemented in Go language which uses an SQL-like language designed for working with time series and analytics.
To display this data we decided to choose Grafana. It’s an easy to use, AngularJS based web-site which has the ability to query InfluxDBs REST interface. One of the advantages of this solution is that it does not require detailed technical knowledge. Moreover I must say that Grafana’s chart displaying layout is very neat.
Installation
To install InfluxDB we need to download a package from the official website and install it via Linux package manager. Grafana is a different story. It’s a static website communicating via AJAX with InfluxDB, so it needs an HTTP server such as Apache.
To save you the pain, I’ve prepared a bash script. First it installs Influx, Grafana and Apache. Then it configures Grafana to communicate with your local InfluxDB (via localhost so you might want to substitute it in config.js) and generates exemplary data persisted into InfluxDB using curl. To download the script, please execute the commands below in your terminal. Bear in mind that the script installs 32-bit version of InfluxDB – if you’ve got a 64bit OS, just change the InfluxDB package URL in the script. One more thing: I’ve tested it only under Ubuntu.
[sourcecode language=”bash” wraplines=”false” collapse=”false”]
wget -O mon-install.sh https://gist.githubusercontent.com/gitplaneta/e559307567cbf02bd78c/raw/65ca4ce29072a2791318196ebb3e0c584c77deb4/gistfile1.sh
chmod +x mon-install.sh
./mon-install.sh
[/sourcecode]
Now you are able to plot a chart in Grafana. Unfortunately I’ve had some problems with floating point precision in Bash so the chart isn’t as pretty as it should but that’s out of scope of this blog post. Let’s plot this ugly … chart!
But before we do that, it’s a good idea to familiarize ourselves with InfluxDB Rest interface.
InfluxDB HTTP interaction
If you open the previous script in the editor, you’ll see that some HTTP requests are being sent to InfluxDB. First, 2 databases are created (one for data and one for Grafana to save its settings) and then one of them is filled with data.
To create a database named “my_new_database”, we send a POST request with JSON body to the InfluxDB instance:
[sourcecode language=”bash” wraplines=”false” collapse=”false”]
curl -X POST ‘http://localhost:8086/db?u=root&p=root’ -d ‘{“name”: “my_new_database”}’
[/sourcecode]
On the other hand, to insert data into the previously created database, we use this POST request with JSON payload:
[sourcecode language=”bash” wraplines=”false” collapse=”false”]
curl -X POST -d ‘[{“name”:”fun”,”columns”:[“val”, “other”],”points”:[[“23.3256”, 100]]}]’ ‘http://localhost:8086/db/my_new_database/series?u=root&p=root’
[/sourcecode]
You might be interested what all these fields mean:
- name – in SQL domain, we would call it a table,
- columns – column names,
- points – an array of values which sequence corresponds to the field “columns”. To make it more efficient you can insert data in bulk, by sending multiple array elements in one request. You can also manipulate the timestamp for each tuple, by adding a column “time” with specific timestamp value, otherwise InfluxDB will associate a timestamp by default.
Ok, so if we managed to create a table and fill it with data, it’s time to query it. Run this request in bash to see what data we previously inserted (this time we use a GET method):
[sourcecode language=”bash” wraplines=”false” collapse=”false”]
curl -G ‘http://localhost:8086/db/my_new_database/series?u=root&p=root&pretty=true’ –data-urlencode “q=select * from my_new_database”
[/sourcecode]
Of course, there are different ways to communicate with InfluxDB, for example you can use the Graphite protocol, send the data via UDP or use any of the language specific clients they provide. There’re many more quirks you can do with it, for more information visit the official docs
Grafana dashboard step by step
First, we will create our dashboard and save it. This way we’ll prove our Grafana configuration is working and it communicates properly with InfluxDB. Navigate to http://localhost/grafana create a dashboard and click save.

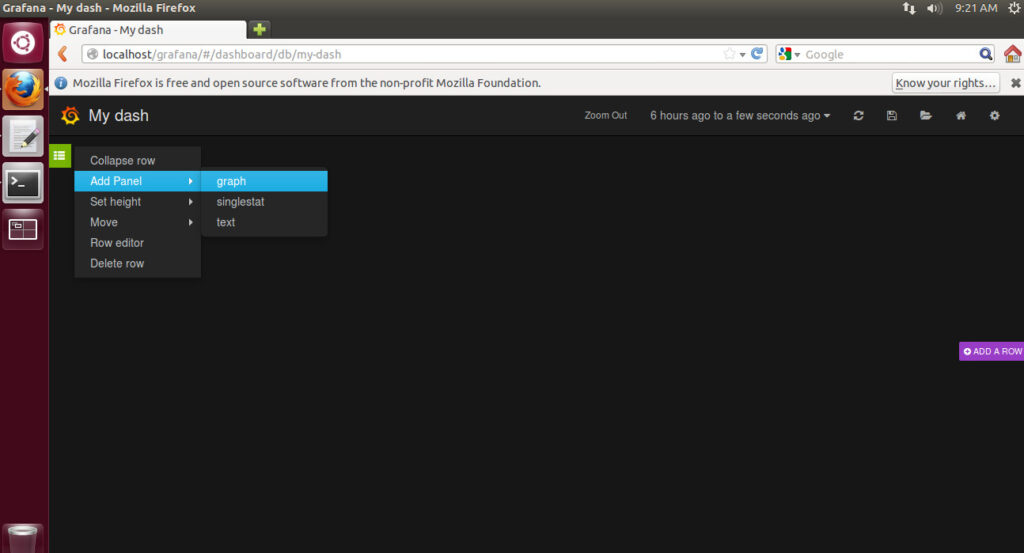
Now let’s create a new chart by following the second screenshot and clicking on the new chart title and then choosing “edit”.
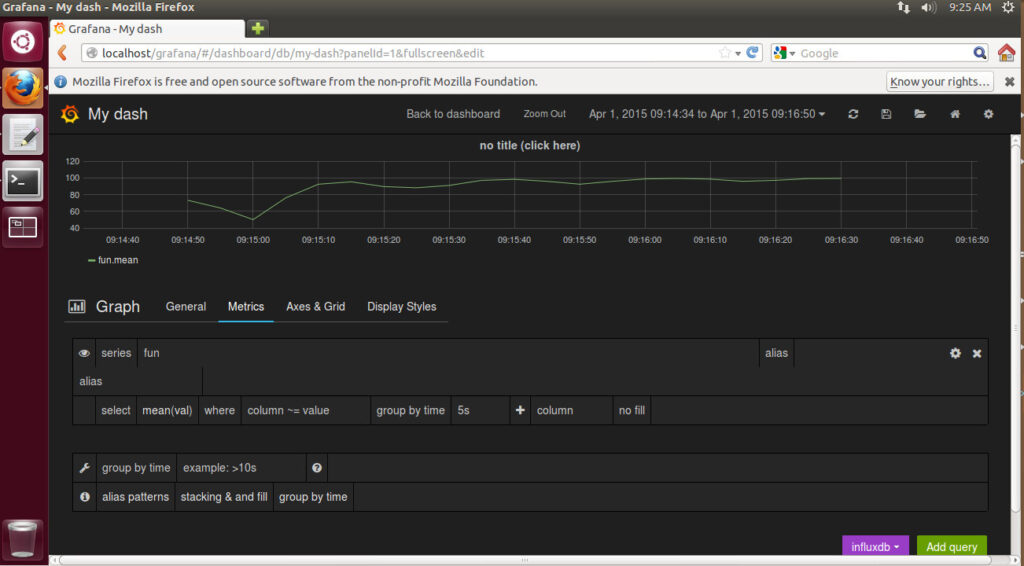
Add a simple query to display a chart. Our data series name is “fun” and column is “val” (this data was generated by our script you’ve run in the installation section).
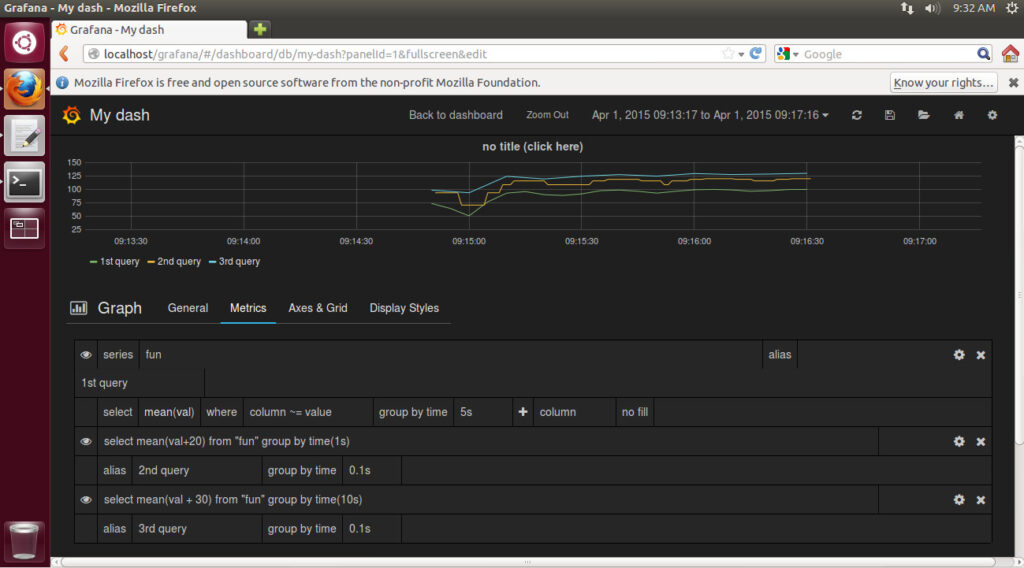
Next, to show more data, add a few queries by hand in row mode by clicking “Add query” and for each query choose “Raw query mode”:
- select mean(val + 20) from “fun” group by time(1s)
- select mean(val + 30) from “fun” group by time(10s)
Result should resemble screenshot 4.
By manipulating the “Display Styles” section and charts colours, I’ve managed to create this graph:
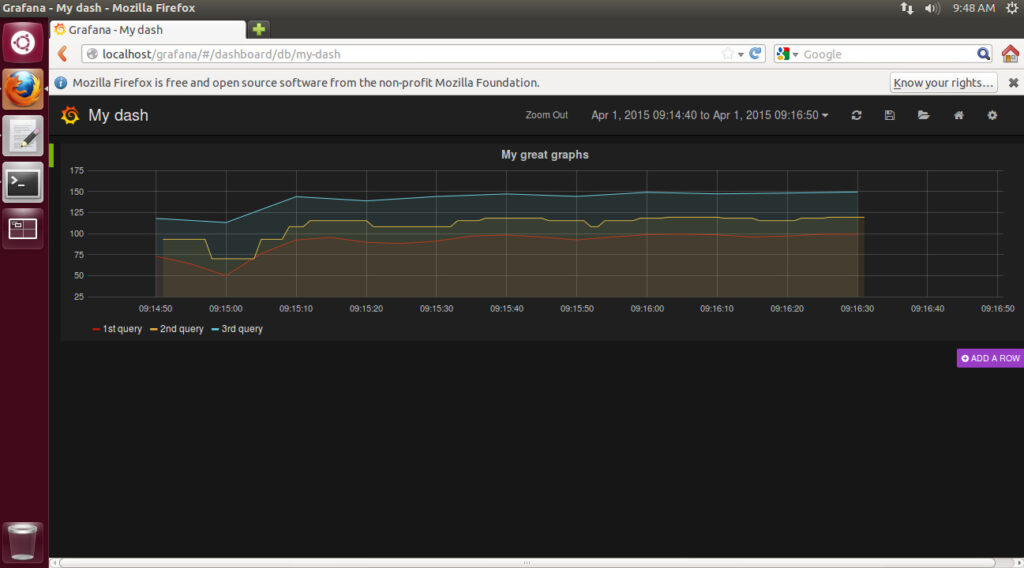
To wrap things up: in this article we’ve managed to configure a simple monitoring environment, we created a sample dashboard with aesthetic graphs and created basic queries for InfluxDB by our own and sent them with curl. Also I’ve showed you a couple of screenshots from Grafana so you could get more familiar with its interface.
Hope you found this post helpful!
author: Radosław Busz
